In the last post I discussed how to find link-worthy & shareable content ideas. Once you have your content planned you will want to evaluate its performance. In order to do this there are a few things you will need to keep track of. And that’s where the information in this post comes in.
Evaluation of the content you create should be performed on a regular basis. Whether content is doing its job or not depends upon whether its ROI is positive or negative. With a little proper planning, evaluating your ROI is fairly straight forward.
The first step is determining your costs.
- Keep track of the time and cost for each piece of content you create. If you have to hire a designer for infographics then add that cost. Keeping track of time can be easily done using Toggl.
- Choose an hourly rate for your time and calculate the cost for the content you create.
The second step is to attribute these costs to specific types of content and content topics.
- Track by the type of content. Track text posts, guides, infographics, interactive, and video content separately. You can then take an average time and cost for each type of content.
- To gain even deeper insights, track the content topic as well.
The third step is determining the ROI. The return on investment may be conversions of any type, social shares, links, et cetera.
- Find the number of conversions, social shares and links for each piece of content
- Evaluate your cost per conversion, cost per share, & cost per link

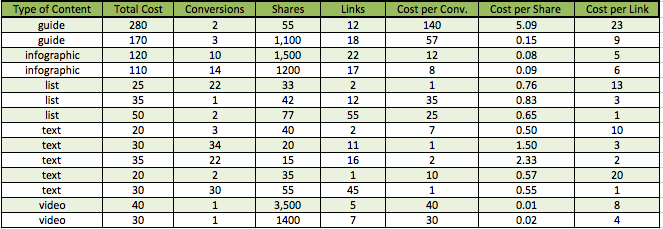
In the spreadsheet above it looks like squirrel content has a very high conversion rate. To test whether this is a fluke or not, continue to create content on squirrels and track the performance against other topics.
The equations used in the spreadsheet can be seen below:
total cost = time cost + other costs
cost per share = total cost / shares
cost per link = total cost / links
cost per conversion = total cost / conversion
The fourth and final step is putting it all together You can now evaluate your content on following criteria:
- Most shared type of content
- Most shared content topics
- Most linked to type of content
- Most linked to content topics
- Average ROI for each type of content
- Average ROI for each content topic

Looking at the data it’s clear that guides, infographics, and videos all receive a lot of shares. This type of content will perform well if awareness is your goal. If conversions are your goal, then text content is your best option.
You may want to create guide, infographic, and video content aimed at awareness and liking. Create text content aimed at those further along in the purchase cycle.
You now have the cost per share, cost per link, and cost per conversion for each type of content and content topic. With a solid grasp on which types of content provide you with the most reward for the effort and cost put into creating them you can put together a content plan that helps you increase awareness, conversion, and other goals of your campaign.
